
Months before an El Niño reshapes weather across the planet — drenching California, parching Australia, and quieting Atlantic hurricanes — scientists already see it coming. Not through folklore or guesswork, but through a planet-spanning sensor network of ocean buoys, satellites, and supercomputer models that watch the tropical Pacific the way cardiologists watch a heartbeat. The forecasts are not perfect, but they routinely flag El Niño events six to nine months before peak impacts.
Understanding how these predictions work matters far beyond academic curiosity. Farmers plan planting seasons around them, water managers adjust reservoir releases, insurers price risk, and emergency planners pre-position resources. Here is the full picture of how scientists predict El Niño years — the measurements, the models, and the honest limits of what forecasting can do.
What Exactly Scientists Are Trying to Predict
El Niño is the warm phase of the El Niño–Southern Oscillation (ENSO), a coupled ocean-atmosphere cycle centered on the tropical Pacific. During El Niño, sea surface temperatures in the central and eastern equatorial Pacific run unusually warm, trade winds weaken, and the atmospheric circulation that normally piles warm water near Asia sloshes it back toward the Americas. The effects ripple worldwide through shifts in the jet stream.
Forecasters at NOAA’s Climate Prediction Center declare El Niño using the Oceanic Niño Index: when the three-month average sea surface temperature anomaly in the Niño 3.4 region stays at or above +0.5°C for five consecutive overlapping seasons. That formal threshold is what turns a warm spell into an official event — and it is the target every prediction system is aiming at.
The Ocean Buoy Network Watching the Pacific
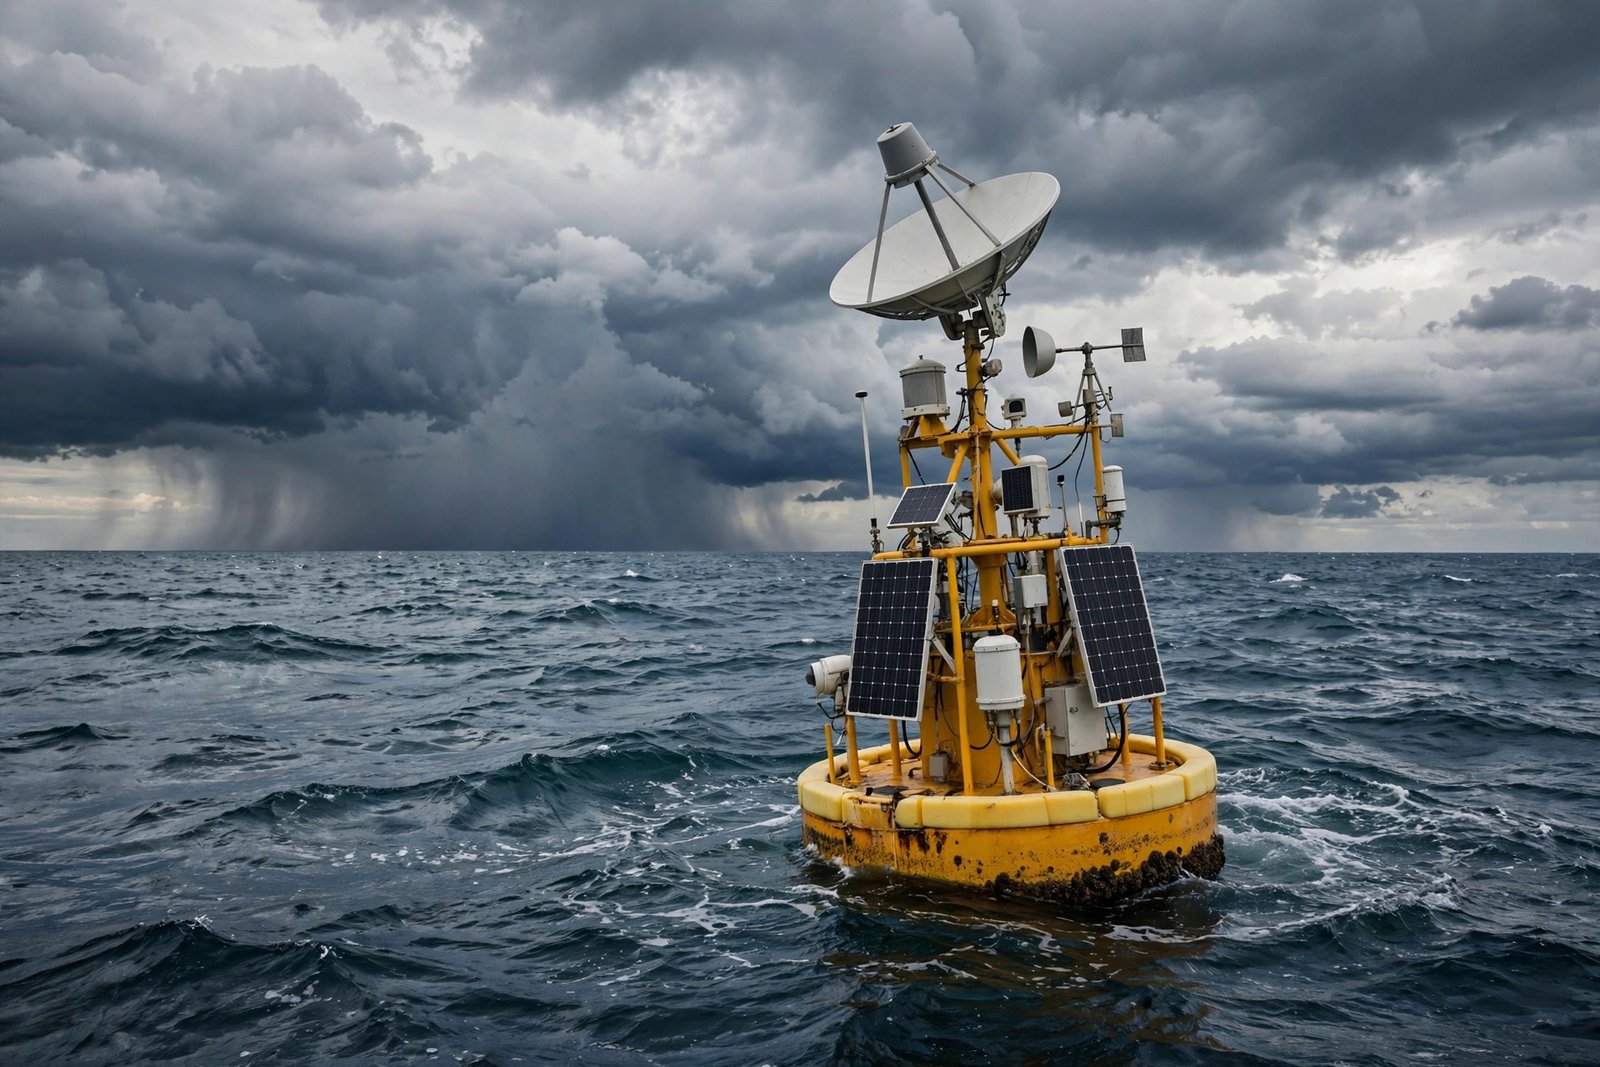
The backbone of El Niño prediction sits moored across the equatorial Pacific: the TAO/TRITON array, roughly 55 buoys stretching from the coast of South America to the waters near Indonesia. Each buoy measures sea surface and subsurface temperatures, winds, humidity, and currents, transmitting data in near real time.
Why Subsurface Heat Matters Most
Surface temperatures tell you what is happening now; subsurface heat tells you what happens next. Before an El Niño, a pool of abnormally warm water builds hundreds of meters below the surface in the western Pacific, then migrates eastward along the thermocline as a Kelvin wave. Buoy sensors at depth detect this heat reservoir weeks to months before it surfaces — it is the single most reliable early warning signal forecasters have. When that warm pool starts moving east, experienced oceanographers start clearing their calendars.
Satellites Reading the Ocean From Orbit
Where buoys give depth at fixed points, satellites give breadth. Infrared and microwave radiometers map sea surface temperatures across the entire Pacific daily, while radar altimetry missions in the Jason series measure sea surface height down to centimeters. Because warm water expands, a bulge in sea level reveals where heat is accumulating below.
Satellites also track the atmospheric half of the equation: outgoing longwave radiation shows where thunderstorm activity — and therefore rising warm air — has shifted, while scatterometers measure surface winds to detect the trade-wind weakening that defines El Niño’s onset. Together, these space-based eyes catch the large-scale pattern changes that buoys alone might miss. The same observing systems that inform seasonal outlooks also feed the short-term forecasts people rely on to dress sensibly for shifting cold-weather patterns when an event rearranges winter storm tracks.
Supercomputer Models That Simulate the Whole System
Raw observations feed coupled ocean-atmosphere models — simulations like NOAA’s Climate Forecast System version 2 — that project conditions months ahead. These models solve the physics of fluid motion, heat exchange, and atmospheric circulation on a global grid, running dozens of slightly different starting scenarios called ensembles. When most ensemble members agree an El Niño is coming, confidence is high; when they scatter, forecasters hedge.
The Spring Predictability Barrier
Forecasts made in spring for the following winter are notoriously less reliable — the famous “spring predictability barrier.” ENSO signals are weakest in boreal spring, so small errors amplify. A March forecast for next winter carries real uncertainty; the same forecast issued in August is far sharper. Skillful prediction typically extends six to nine months, with accuracy climbing steeply as the target season approaches. Anyone making big bets on a spring forecast is gambling, not planning.
How Forecasters Turn Data Into Public Outlooks
Each month, NOAA issues an ENSO diagnostic discussion synthesizing observations, model ensembles, and forecaster judgment into probability statements — for example, a 70 percent chance of El Niño persisting through winter. These outlooks drive seasonal climate forecasts worldwide: wetter-than-average odds for the southern United States, drier odds for the Pacific Northwest and Australia, suppressed Atlantic hurricane activity, and altered monsoons.
The probabilities are the point. Seasonal forecasting is risk communication, not prophecy. A “60 percent chance of a wetter winter” means wetter outcomes occur in six of ten similar past situations — genuinely useful for reservoir operators deciding how much water to release, or for households in humid regions thinking about which fabrics handle hot, humid weather best during an El Niño-amplified warm season.
What Prediction Still Cannot Do
Honesty requires the caveats. Models predict the occurrence of El Niño far better than its strength — the difference between a weak event and a monster like 1997–98 or 2015–16 often stays unclear until late. Regional impacts vary enormously between events; two strong El Niños can deliver very different winters to the same city. And beyond about nine to twelve months, skill fades toward climatology. Climate change adds another wrinkle: a warming baseline may be subtly altering ENSO behavior, and researchers are still disentangling the signal.
Conclusion
Scientists predict El Niño years by combining deep-ocean buoy measurements, satellite surveillance, and ensemble supercomputer models — with subsurface heat content as the star early indicator and the spring months as the acknowledged weak spot. The system routinely delivers six to nine months of warning, enough for farmers, water managers, and emergency planners to act. It will not tell you exactly how strong an event will be or precisely what your town’s winter will look like, but as an early-warning risk tool, it is one of the great quiet triumphs of modern Earth science.
Further reading: For more on this topic, see Climate.gov’s El Niño–Southern Oscillation portal.
Frequently Asked Questions
How far in advance can scientists predict El Niño?
Skillful forecasts typically extend six to nine months ahead, with accuracy improving as the event approaches. Forecasts issued in late summer for the coming winter are considerably more reliable than those made in spring, thanks to the spring predictability barrier.
What is the most important early warning sign of El Niño?
A buildup of warm water below the ocean surface in the western Pacific, detected by the TAO/TRITON buoy array. This subsurface heat migrates eastward months before surface temperatures spike, making it the most reliable precursor forecasters monitor.
Can scientists predict how strong an El Niño will be?
Only roughly, and usually late. Models are much better at predicting whether El Niño will occur than at pinning down its intensity early. The difference between weak and record-breaking events often remains unclear until the event is already underway.
Does El Niño affect weather where I live?
Possibly — its influence is global but uneven. In the United States, El Niño winters tend to be wetter in the South and drier and warmer in the Pacific Northwest. Check NOAA’s seasonal outlooks for your region rather than assuming a specific local outcome.