
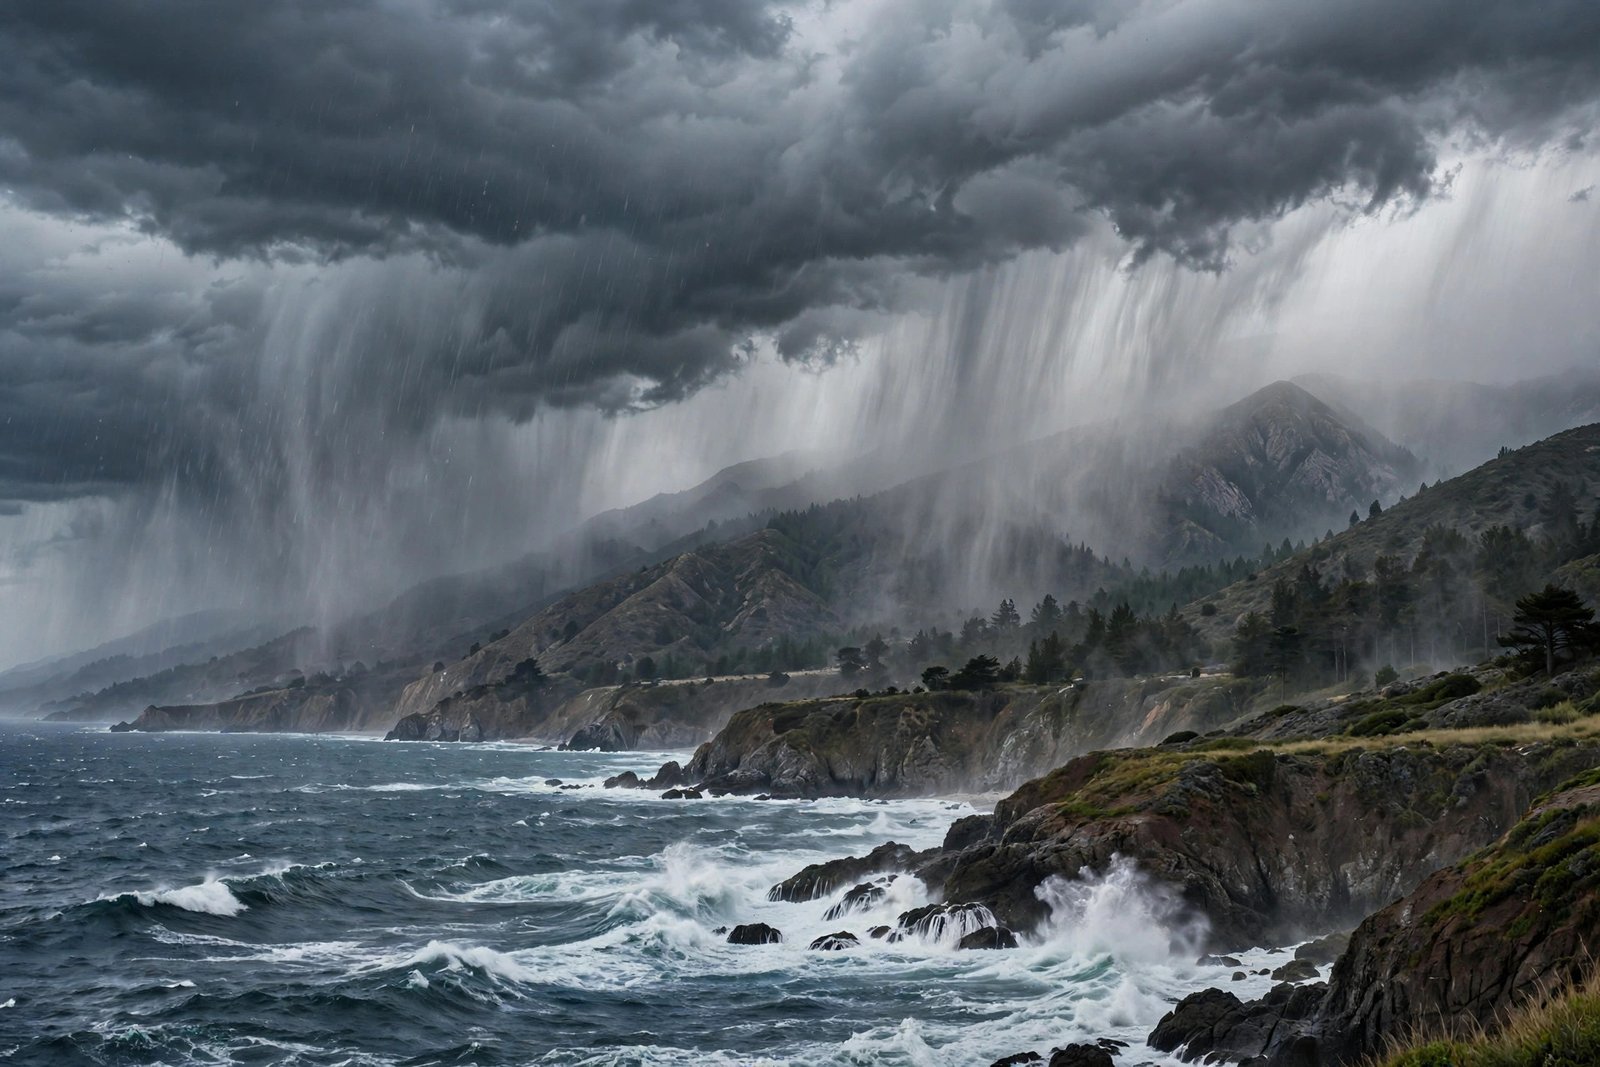
They are rivers in the sky — narrow corridors of concentrated moisture, thousands of miles long and only a few hundred miles wide, hauling more water vapor than the Mississippi River carries past New Orleans. When one makes landfall on the West Coast, it can end a drought in a week or drown a town in a day. Scientists call them atmospheric rivers, and they are among the most consequential weather phenomena most people have never heard of.
California receives somewhere between a third and half of its annual precipitation from just a handful of these events each winter. The infamous “Pineapple Express” that soaks the coast is simply the most famous member of the family. Understanding atmospheric rivers — how they form, how scientists rank them, and why they are both blessing and menace — is essential for anyone living west of the Rockies.
How an Atmospheric River Forms
An atmospheric river begins over warm tropical or subtropical oceans, where evaporation loads the lower atmosphere with water vapor. Powerful low-pressure systems and their associated cold fronts then act like conveyor belts, sweeping that moisture into a focused filament and steering it toward land. The plume typically sits just ahead of the cold front, riding the strong winds of the low-level jet stream.
When this moisture stream slams into coastal mountains — the Sierra Nevada, the Cascades, the Coast Ranges — the air is forced upward in a process called orographic lift. Rising air cools, vapor condenses, and the result is intense, prolonged rainfall on windward slopes and heavy snowfall at higher elevations. One strong atmospheric river can drop several inches of rain in 24 hours and feet of mountain snow. NOAA’s atmospheric river research programs track these plumes with dedicated reconnaissance flights that drop sensors directly into the moisture stream.
The AR Scale: Ranking Rivers in the Sky
Not all atmospheric rivers are equal, which is why researchers at the Center for Western Weather and Water Extremes developed a five-category scale, analogous to hurricane categories. The AR scale ranks events from AR 1 (weak, mostly beneficial) to AR 5 (exceptional, primarily hazardous), based on intensity — how much moisture transport occurs — and duration.
Beneficial Versus Hazardous Events
AR 1 and AR 2 events are the workhorses of Western water supply: they refill reservoirs, build snowpack, and end dry spells with manageable impacts. AR 4 and AR 5 storms are a different animal, capable of unleashing catastrophic flooding, mudslides on burn scars, and destructive winds. The cruel arithmetic of the West is that the same storms that prevent drought cause the floods — water managers must capture the bounty while bracing for the damage, sometimes within the same week.
Why the West Coast Depends on Them
The western United States has a Mediterranean climate: rain falls almost entirely in winter, and atmospheric rivers deliver the bulk of it. Research shows that a few large events per season account for up to half of California’s yearly water. Miss those storms, and drought deepens; catch too many strong ones in sequence, and levees fail.
This dependence makes atmospheric river forecasting a water-management superpower. Reservoir operators use forecast-informed operations to decide when to release water ahead of a big storm and when to hold it. Getting that call right means the difference between flood control and water supply — the eternal tension of Western hydrology. For residents, the practical side is simpler but no less real: when a strong AR is forecast, it pays to think about how humidity affects your home and to clear drains and gutters before the deluge arrives.
Atmospheric Rivers Around the World
Though famous in California, atmospheric rivers strike many coastlines. They drench the Pacific Northwest, slam into the British Isles and Norway as the “conveyor belt” of Atlantic storms, soak Chile’s narrow coast, and even reach Antarctica, where rare events have caused surface melting on ice shelves. Wherever warm ocean moisture meets mountainous western coastlines, the physics works the same way.
Climate Change Is Supercharging Them
A warmer atmosphere holds about 7 percent more moisture per degree Celsius — the Clausius-Clapeyron relationship — and atmospheric rivers are essentially moisture-delivery machines. Climate projections consistently show these storms carrying more water vapor, producing more intense precipitation, and shifting the balance toward hazardous AR 4 and AR 5 events. Total annual precipitation may not change dramatically in some regions, but it arrives in fiercer bursts with longer dry spells between — a “feast or famine” hydrology that strains infrastructure designed for the gentler rhythms of the past century.
How Forecasters Track Them Today
Prediction has improved enormously. Satellite-based microwave sensors map total water vapor in the plume, reconnaissance aircraft sample the storm’s core, and high-resolution models now resolve the narrow filament structure that coarser models smeared out. Forecast skill for atmospheric river landfall location and intensity extends usefully to about five to seven days — enough for emergency managers to stage resources and for dam operators to create flood space. The remaining frontier is precision: predicting exactly which watershed gets the heaviest band, a detail that decides which towns flood.
Historic Atmospheric River Disasters
History offers sobering case studies. The Great Flood of 1861–62 — likely a sequence of powerful atmospheric rivers — inundated California’s Central Valley under up to 30 feet of water, bankrupted the state, and moved the capital from Sacramento to San Francisco temporarily. Modern modeling of a repeat, dubbed the “ARkStorm” scenario by the USGS, projects hundreds of billions in damages.
More recently, February 2017 brought a parade of atmospheric rivers that filled Lake Oroville so fast that both the main and emergency spillways of Oroville Dam were compromised, forcing the evacuation of 188,000 people downstream. In early 2023, another relentless series of nine atmospheric rivers in three weeks ended California’s punishing drought — while simultaneously causing levee breaches, flooded farmland, and dozens of deaths. Each event underscores the same lesson: in the West, water salvation and water catastrophe arrive on the same storm track.
Conclusion
Atmospheric rivers are the West’s double-edged sword: the same sky rivers that fill reservoirs and build snowpack also trigger the floods and mudslides that make headlines. Ranked on a five-level scale, steered by low-pressure systems, and intensifying in a warming climate, they deserve a place in every Westerner’s weather vocabulary. Watch the forecasts when one approaches — and respect what a river in the sky can do.
Further reading: For more on this topic, see which fabrics hold up best in hot, humid weather and National Weather Service forecasts and alerts.
Frequently Asked Questions
What is an atmospheric river in simple terms?
A long, narrow band of concentrated moisture in the atmosphere that transports huge amounts of water vapor from the tropics to mid-latitudes. When it hits land and mountains, it produces intense rain or snow — essentially a river in the sky.
Is the Pineapple Express an atmospheric river?
Yes. The Pineapple Express is a well-known type of atmospheric river that taps tropical moisture near Hawaii and streams it toward the U.S. West Coast, often bringing heavy rain and warm, melting snowpack conditions.
Are atmospheric rivers good or bad?
Both. Weaker events (AR 1–2) are vital for water supply and drought relief; stronger ones (AR 4–5) cause destructive flooding and mudslides. The West Coast depends on them for up to half its annual precipitation while simultaneously fearing their extremes.
How does climate change affect atmospheric rivers?
Warmer air holds more moisture, so atmospheric rivers are projected to carry more water vapor and produce more intense precipitation. Expect fiercer storms and longer dry gaps between them in a warming climate.